Case Study
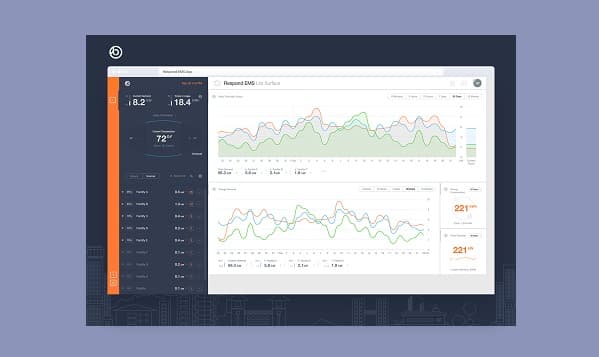
Brighterlink Dashboard
Energy2018Web
Key Challenge
Visualizing complex, multi-source solar energy data into actionable insights for end-users.
Our Approach & Solution
Engineered an Angular dashboard with real-time data visualization and predictive analytics for energy forecasting.
Technology Deep Dive
A strategic selection of technologies was used to ensure long-term stability and high performance:
Data Viz
Custom D3.js and Angular components for high-fidelity energy charts.
API
Node.js REST API designed for high-frequency IoT data ingestion.
Stack: Angular, Node
Results
Key outcomes from the successful delivery of this project:
- 15% reduction in energy waste through increased user awareness
- Seamless integration with hardware monitoring systems
- Scalable to thousands of energy nodes