

Custom Dashboards vs. Spreadsheets: Why Your Data Needs UI
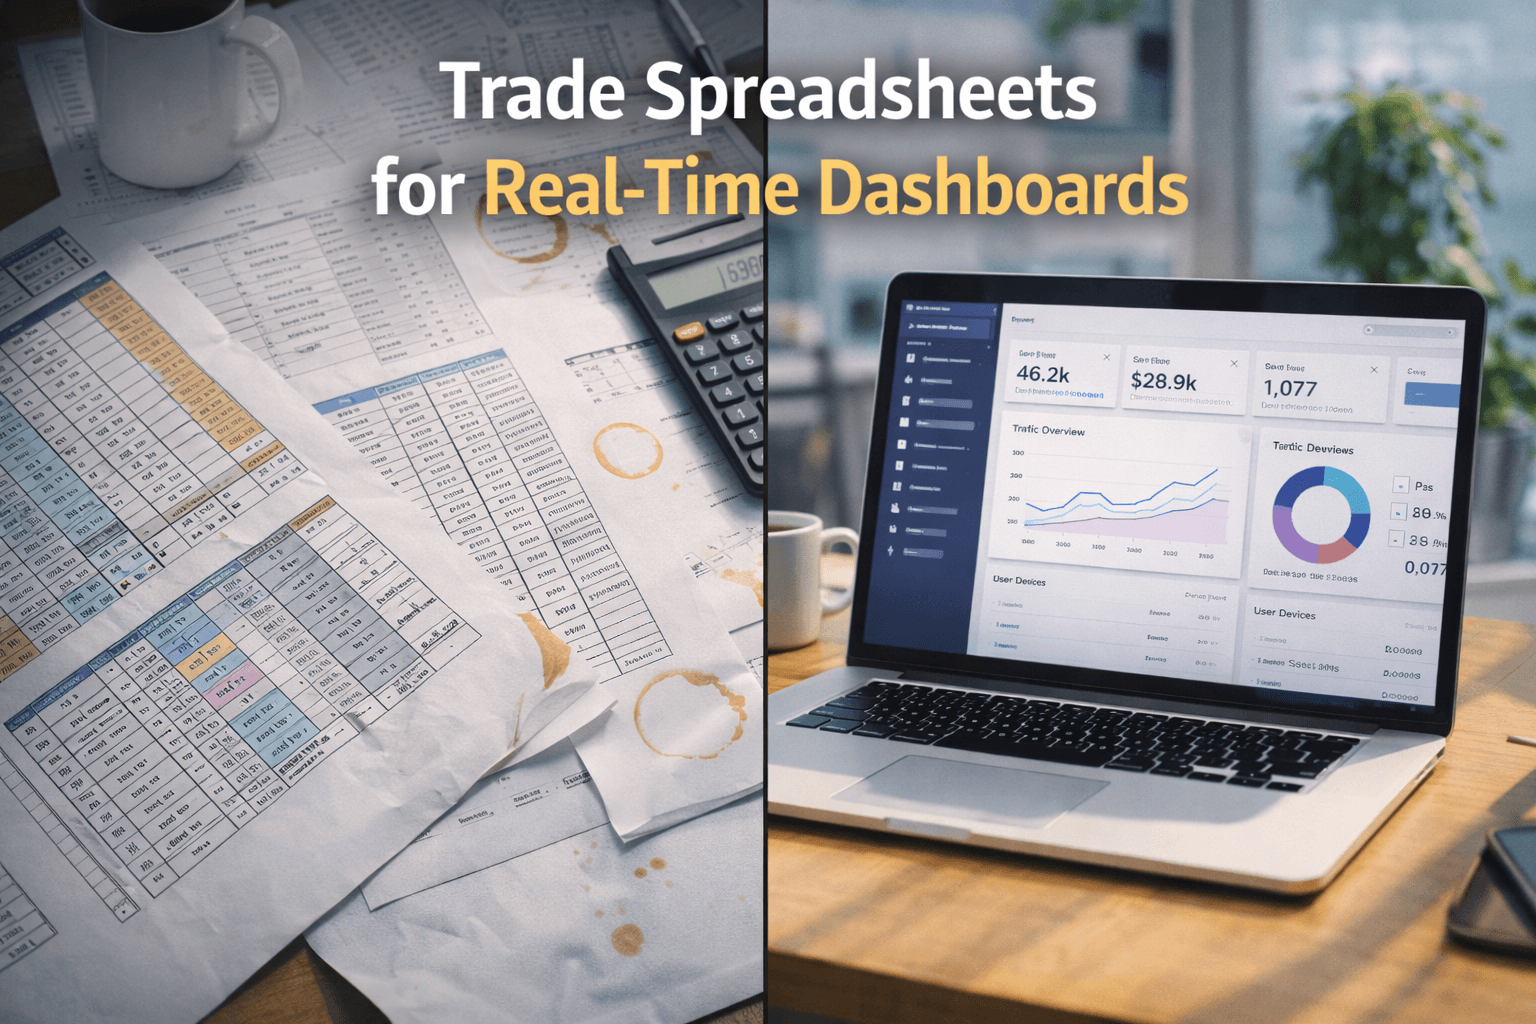
Your team spends hours every week building reports in Excel. A custom dashboard does it in real time — and pays for itself within months.
The Value of Custom Dashboards for Business Scaling
Your director of operations spends 6 hours every Monday morning copying data from three different tools into a spreadsheet so the leadership team can see last week's numbers.
That spreadsheet is costing your company more than you think.
The Spreadsheet Tax
Spreadsheets are incredible tools — for individuals. For running a business? They're a liability.
Here's what goes wrong:
Manual data entry = human error. Studies show that 88% of spreadsheets contain at least one error. When your financial reports, inventory counts, or sales forecasts are based on manual data entry, you're making decisions on bad data.
Static snapshots = stale decisions. Your spreadsheet shows what happened last week. Your competitor's dashboard shows what's happening right now. Who makes better decisions?
Single point of failure = risk. When the person who built the spreadsheet leaves, nobody understands the formulas. We've seen companies lose months of productivity because their "reporting system" was a single Excel file on someone's laptop.
What a Custom Dashboard Actually Does
A custom dashboard connects directly to your data sources — your CRM, payment processor, inventory system, marketing tools — and displays real-time metrics in one place.
No manual entry. Data flows automatically.
No waiting for Monday. Check your numbers anytime, from any device.
No single point of failure. It runs on a server, not someone's desktop.
Real examples:
| Business Type | Spreadsheet Pain | Dashboard Solution |
|---|---|---|
| E-commerce | Weekly revenue report takes 3 hours | Real-time revenue, orders, and inventory |
| Agency | Project profitability calculated monthly | Live margin tracking per project |
| SaaS | Churn analyzed quarterly in Excel | Daily churn alerts with cohort analysis |
| Logistics | Fleet status updated via radio calls | Live GPS tracking + delivery ETAs |
The ROI Math
If your team spends 10 hours/week on manual reporting across all departments, at an average cost of $40/hour:
10 hours × $40 × 52 weeks = $20,800/year wasted on work a dashboard does instantly.
A custom dashboard typically costs $15,000–$50,000 to build. It pays for itself in year one and keeps saving every year after.
Factor in better decisions from real-time data and the ROI multiplies.
When a Spreadsheet Is Still Fine
Not everything needs a dashboard:
- One-time analysis or ad hoc calculations
- Personal task tracking
- Quick what-if scenarios
- Fewer than 100 rows of data that rarely change
But if you're running a team, department, or company on spreadsheets — you've outgrown them.
Ready to replace your spreadsheets with real-time intelligence? MAGEHIRE builds custom dashboards that connect all your data sources into one clean view. Let's talk about what you need to see.
Related expertise: Scale your product with our Backend Engineering and AI Automation services.
What is The Value of Custom Dashboards for Business Scaling?
This solution focuses on solving core business challenges through strategic technical implementation. At its heart, it leverages modern engineering to drive operational efficiency and scalability.
How it Works
Magehire follows a rigorous 4-step methodology to ensure delivery excellence:
- Discovery: Mapping business goals to technical requirements.
- Architecture: Designing scalable, future-proof systems.
- Agile Build: Iterative development with transparent progress tracking.
- Launch & Scale: Strategic deployment and continuous optimization.
Primary Use Cases
- B2B SaaS: Building multi-tenant platforms with complex permission logic.
- Enterprise Modernization: Transitioning legacy systems to modern cloud infrastructures.
- AI Integration: Automating repetitive workflows to reduce operational overhead.
Cost and ROI Analysis
Investing in professional development is about long-term value. While initial costs range based on scope, the return on investment (ROI) is realized through reduced maintenance costs, improved user adoption, and the ability to scale without technical debt blocks.
When to Choose This Solution
Choose this approach when your business requires a high degree of customization, reliability, and technical leadership that generic off-the-shelf solutions cannot provide.
?Frequently Asked Questions
Keep Reading
Explore more insights from our team

Etched Hits $5B Valuation and $1B Sales in AI Chip Market
Etched emerges as a formidable rival to Nvidia, achieving a $5 billion valuation and $1 billion in sales, reshaping the AI chip landscape.
How to Automate Business Processes With LLMs in 2026
Step-by-step framework for identifying which business processes are LLM-automatable, designing the pipeline architecture, selecting orchestration tools (LangChain, n8n, custom), and building validation layers that make outputs production-safe.
Scale Your Project
Ready to build high-performance software? Our experts in New York handle the technical heavy lifting so you can focus on growth.
Get a Free Consultation